Everything you need to know about construction measured mile analysis


Imagine you’re racing two identical cars. One speeds down a wide-open motorway , the other crawls through gridlocked traffic. No surprises, the car on the open road wins every time.
This is the essence of measured mile analysis in construction. It is an important methodology that compares work performed under optimum/ideal conditions to the same type of work that has been disrupted by delays, inefficiencies, or unforeseen issues affecting progress. By analysing and quantifying the impact of these disruptions, it provides hard data to support claims, resolve disputes, and ultimately improve productivity for future tasks and projects
Personally, I think of it as a cheat code for more intelligent decision-making as it gives you the wisdom to spot inefficiencies, recover costs, and optimize future projects. But to do it right, you need accurate calculations, not rough estimates.
This guide walks you through everything you need to know, from basic principles to step-by-step calculations, to turn project delays into actionable intelligence.
Why measured mile analysis matters
Construction projects rarely work out as they're designed. Delays pile up, expenses balloon, and productivity declines. Without precise data, it's easy for there to be disputes over who's responsible—and even harder to recover lost time and money.
That's where measured mile analysis is a life-saver. By providing an objective, measurable means of gauging loss of productivity, it allows project managers, engineers, and contractors to make intelligent decisions.
Here's why it's so important:
- Recognises Productivity Losses – Distinguishes losses down to the precise point and time where performance was degraded.
- Quantifies Financial Impact – Converts lost productivity to concrete cost, making claims and negotiations more convincing.
- Strengthens Dispute Resolution – Provides definite proof in delay disputes, cutting out subjective bluffing.
- Improves Future Planning – Indicates inefficiencies or potential areas of unproductivity so teams can make changes to scheduling, resourcing, and estimating.
Another theoretical example:
Assume a team are pouring concrete. Under favourable circumstances, they deliver 100 cubic metres in a shift. But under site congestion and tardy delivery of material circumstances, output sinks to 65 cubic metres. Measured mile analysis captures this 35% reduction, allowing the contractor to pinpoint delays to specific causes—and charge the employer for the loss.
With the right data and calculations, measured mile analysis turns assumptions into facts, putting you in control of your project's productivity and profitability.
Where did measured mile analysis come from?
The evolution of measured mile analysis
Measured mile analysis has come a long way from ballpark estimates and gut-feel decisions. Previously, contractors relied on broad cost categories or rough analogies to quantify productivity losses. These methods were inaccurate, often leading disputes to be founded on subjective interpretations rather than hard data.
As construction became more sophisticated, so did the tools with which to analyse it:
- Traditional methods – Productivity was gauged by tracking time and cost versus tender estimates, usually using paper-based records and manual reports.
- Digitalisation – Spreadsheets facilitated more structured monitoring, but data collection still remained fragmented and prone to human error.
- Data-driven solutions – Modern construction record systems and AI-driven analytics have turned measured mile analysis into a precise, evidence-based science. Today, granular site data can be captured in real time, providing incontrovertible proof of productivity losses and the underlying causes.
The role of measured mile analysis today
Construction projects today are increasingly complex puzzles, each piece representing multiple stakeholders, finite budgets, and lofty expectations usually around the programme. It's a risky game to trust intuition to gauge productivity—without data-driven, systematic measurements, projects get out of hand in the blink of an eye.
Measured mile analysis provides an equitable, transparent framework for revealing inefficiencies, substantiating claims, and continuously enhancing throughout the project lifecycle. It ensures that project teams don't just react to delays but instead actively measure and control them—turning losses in productivity into usable information rather than costly conflicts.
Key concepts and terminologies
- Measured mile – A method of productivity analysis that compares a section of work completed under normal, unimpacted conditions (the "measured mile") with a section of work affected by delays, disruptions, or inefficiencies. This allows for an objective, data-driven comparison to quantify lost productivity without the usual opinion and assumptions.
- Baseline productivity – Production rate as anticipated under normal conditions, unencumbered by external factors such as weather holdups, delayed material delivery, or absence of resources. It is generally approximated by averaging productivity rates from an uninterrupted period or comparable project stage / tender norms.
- Control point – A standard or reference point against which deviations in productivity are gauged. Control points are often set through specific work packages, levels of production, or milestones to track deviations with the elapse of time and across different work sections.
- Deviation analysis – The process of quantifying productivity change by comparing the actual performance of disrupted work to the measured mile. This includes calculating the percentage of lost efficiency and determining whether additional time or costs are recoverable under the contract.
The measured mile analysis process
Step 1: Define the scope and objectives
Choose construction tasks where performance can be measured in specific units:
- Concrete pouring (cubic metres per hour)
- Steel erection (tons per hour)
- Excavation (cubic metres per day)
- Piping installation (linear metres per shift)
Define Key Performance Indicators (KPIs):
- Productivity Rate = Work Completed ÷ Time Taken
- Cost per Unit of Work = Total Cost ÷ Work Completed
- Labour Hours per Unit of Work = Total Labour Hours ÷ Work Completed
Example Calculation: Baseline Productivity KPI
- Work Completed: 500 metres of piping
- Time Taken: 10 days
- Workforce: 5 workers
Productivity Rate = 500 metres ÷ 10 days = 50 metres per day
Step 2: Establish a baseline productivity
To determine deviations, you first need an undisturbed reference section where productivity was consistent and unimpacted by external delays.
- Select the measured mile – Identify a section where productivity was consistent and free from disruptions.
- Document site conditions – Record workforce composition, equipment use, material availability, and environmental conditions. Allocate this resource to activities.
- Record production rates – Gather historical data to confirm consistent performance.
Example: Selecting a Baseline for Drainage Pipe Installation
A 1 km (1,000 metres) section was completed under normal conditions in 10 days.
Baseline Productivity = 1,000 metres ÷ 10 days = 100 metres per day
Step 3: Identify impacted work sections
Determine sections affected by disruptions – Identify delays caused by:
- Weather conditions (rain, extreme temperatures, flooding)
- Supply chain issues (late materials, incorrect deliveries)
- Design changes (rework, revised specifications)
- Reduced workforce (labour shortages, crew reassignments)
Collect productivity data – Measure the actual output of impacted sections.
Compare impacted performance with the baseline.
Example: Identifying an Impacted Section
- Work Completed: 700 metres
- Time Taken: 10 days
- Reason for Delay: Site congestion
Impacted Productivity = 700 metres ÷ 10 days = 70 metres per day
Step 4: Conduct deviation analysis
4a. Calculating productivity loss (%)
To measure how much productivity has dropped, compare the impacted work section to the baseline.
Formula:
Productivity Loss (%) = ((Baseline Productivity - Impacted Productivity) ÷ Baseline Productivity) × 100
Example Calculation
Baseline Productivity = 100 metres per day
Impacted Productivity = 70 metres per day
Productivity Loss (%) = ((100 - 70) ÷ 100) × 100
= (30 ÷ 100) × 100
= 30% productivity loss
4b. Calculating Extra Labour Costs
To find out the cost of lost productivity, multiply the lost work by the cost per unit and the duration of the impact.
Formula:
Extra Labour Cost (£) = Lost Productivity × Labour Cost per Unit × Number of Impacted Days
Example Calculation
Lost Productivity = 30 metres per day (100 - 70)
Labour Cost per Metre = £50
Number of Impacted Days = 10
Extra Labour Cost (£) = 30 × 50 × 10
= £15,000
Step 5: Reporting and Decision Making
Compile findings into a structured report that includes:
- Graphs, charts, and tables to visualise productivity trends.
- Deviation analysis results comparing measured mile sections to impacted areas.
- Recommendations for process improvements or disruption claims.
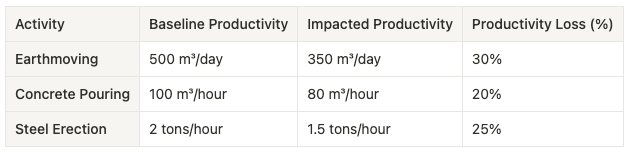
Example Report Table:
Worked examples
Practical example 1: Measured mile analysis for concrete pouring
Scenario
A contractor is responsible for pouring concrete for a 5 km section of highway. Unexpected supply chain disruptions caused intermittent material shortages, leading to reduced productivity. The contractor conducts a measured mile analysis to quantify the impact of these delays.
Measurement Process
Baseline (Undisturbed Work)
- Distance Completed: 1 km
- Duration: 10 days
- Crew Size: 8 workers
- Productivity Rate: 1,000 metres ÷ 10 days = 100 metres per day
Impacted Section
- Distance Completed: 1 km
- Duration: 15 days
- Crew Size: 8 workers
- Productivity Rate: 1,000 metres ÷ 15 days = 66.7 metres per day
Productivity Loss Calculation
Productivity Loss (%) = ((Baseline Productivity - Impacted Productivity) ÷ Baseline Productivity) × 100
= ((100 - 66.7) ÷ 100) × 100
= 33.3% reduction in productivity
Outcome
- The analysis demonstrated a 33.3% productivity loss directly attributed to material shortages.
- The contractor used this data to submit a compensation claim for additional time and costs due to supply delays.
- As a result, the project owner approved an extension of time (EOT) and compensation for additional labour costs incurred during the impacted period.
Practical example 2: measured mile analysis for steel erection
Scenario
A contractor responsible for erecting steel structures for a commercial building encountered unexpected high winds, slowing down lifting operations and overall assembly. To quantify the disruption, the contractor conducted a measured mile analysis.
Measurement process
Baseline (Undisturbed Work)
- Steel Erected: 200 tons
- Duration: 20 days
- Crew Size: 10 workers
- Productivity Rate: 200 tons ÷ 20 days = 10 tons per day
Impacted Section
- Steel Erected: 200 tons
- Duration: 30 days
- Crew Size: 10 workers
- Productivity Rate: 200 tons ÷ 30 days = 6.67 tons per day
Productivity loss calculation
Productivity Loss (%) = ((Baseline Productivity - Impacted Productivity) ÷ Baseline Productivity) × 100
= ((10 - 6.67) ÷ 10) × 100
= 33.3% reduction in productivity
Outcome
- The contractor provided the measured mile analysis report as evidence of the impact caused by high winds.
- The project owner approved a time extension, recognising that the slowdown was beyond the contractor’s control.
- No penalties were applied for delays, and the contractor was able to adjust future scheduling to mitigate similar risks by improving contingency planning for weather-related delays.
How to do this with Gather
Gather ensures that site records align with contract clauses by capturing real-time data on work progress and disruptions. By implementing a systematic methodology for capturing site records, losses of productivity can be linked back to contractual entitlement, such as compensation for unforeseen delays or extensions of time.
Records of completed work, delays, and resource use can be matched against NEC, JCT, or FIDIC contract clauses, ensuring compliance with notice periods and substantiating claims.
Productivity variances are computed automatically with an open audit trail showing the impact of disruptions.
Disruption data is readily available to be applied in contractual conflict resolution, reducing dependence on subjective findings or partial records.
By ensuring a project maintains aligned, structured records, contractors can ensure that claims for lost time or additional costs are backed by factual, contract-compliant data rather than estimates or assumptions.
Key takeaways
Measured mile analysis isn't just some dry calculation; it's a real game-changer when it comes to managing construction projects, sorting out disputes, and boosting efficiency. With this method, contractors can actually quantify how much productivity has been lost, back up their claims with solid evidence, and make a strong case for why they need more time or money.
Why should you care?
- Stronger claims: Contractors can safeguard their project commercial outcomes and get fairly compensated for those unexpected delays that throw everything off.
- Smarter project planning: Understanding productivity trends allows for better planning of manpower, resources, and overall optimisation of the project schedule.
- Decisions based on facts, not feelings: Instead of relying on gut feelings or assumptions, measured mile analysis delivers concrete, undeniable proof of how disruptions have impacted the project.
Accuracy is paramount in the construction industry. A project's success hinges on keeping a close eye on progress, spotting inefficiencies, and adjusting the plan as needed. Measured mile analysis is one of the best tools we have for achieving this.


Stay ahead of the curve
Our monthly email newsletter keeps you up-to-date with best practices in project management, contech implementation and NEC4.